
A clearer view of Dubai market stress.
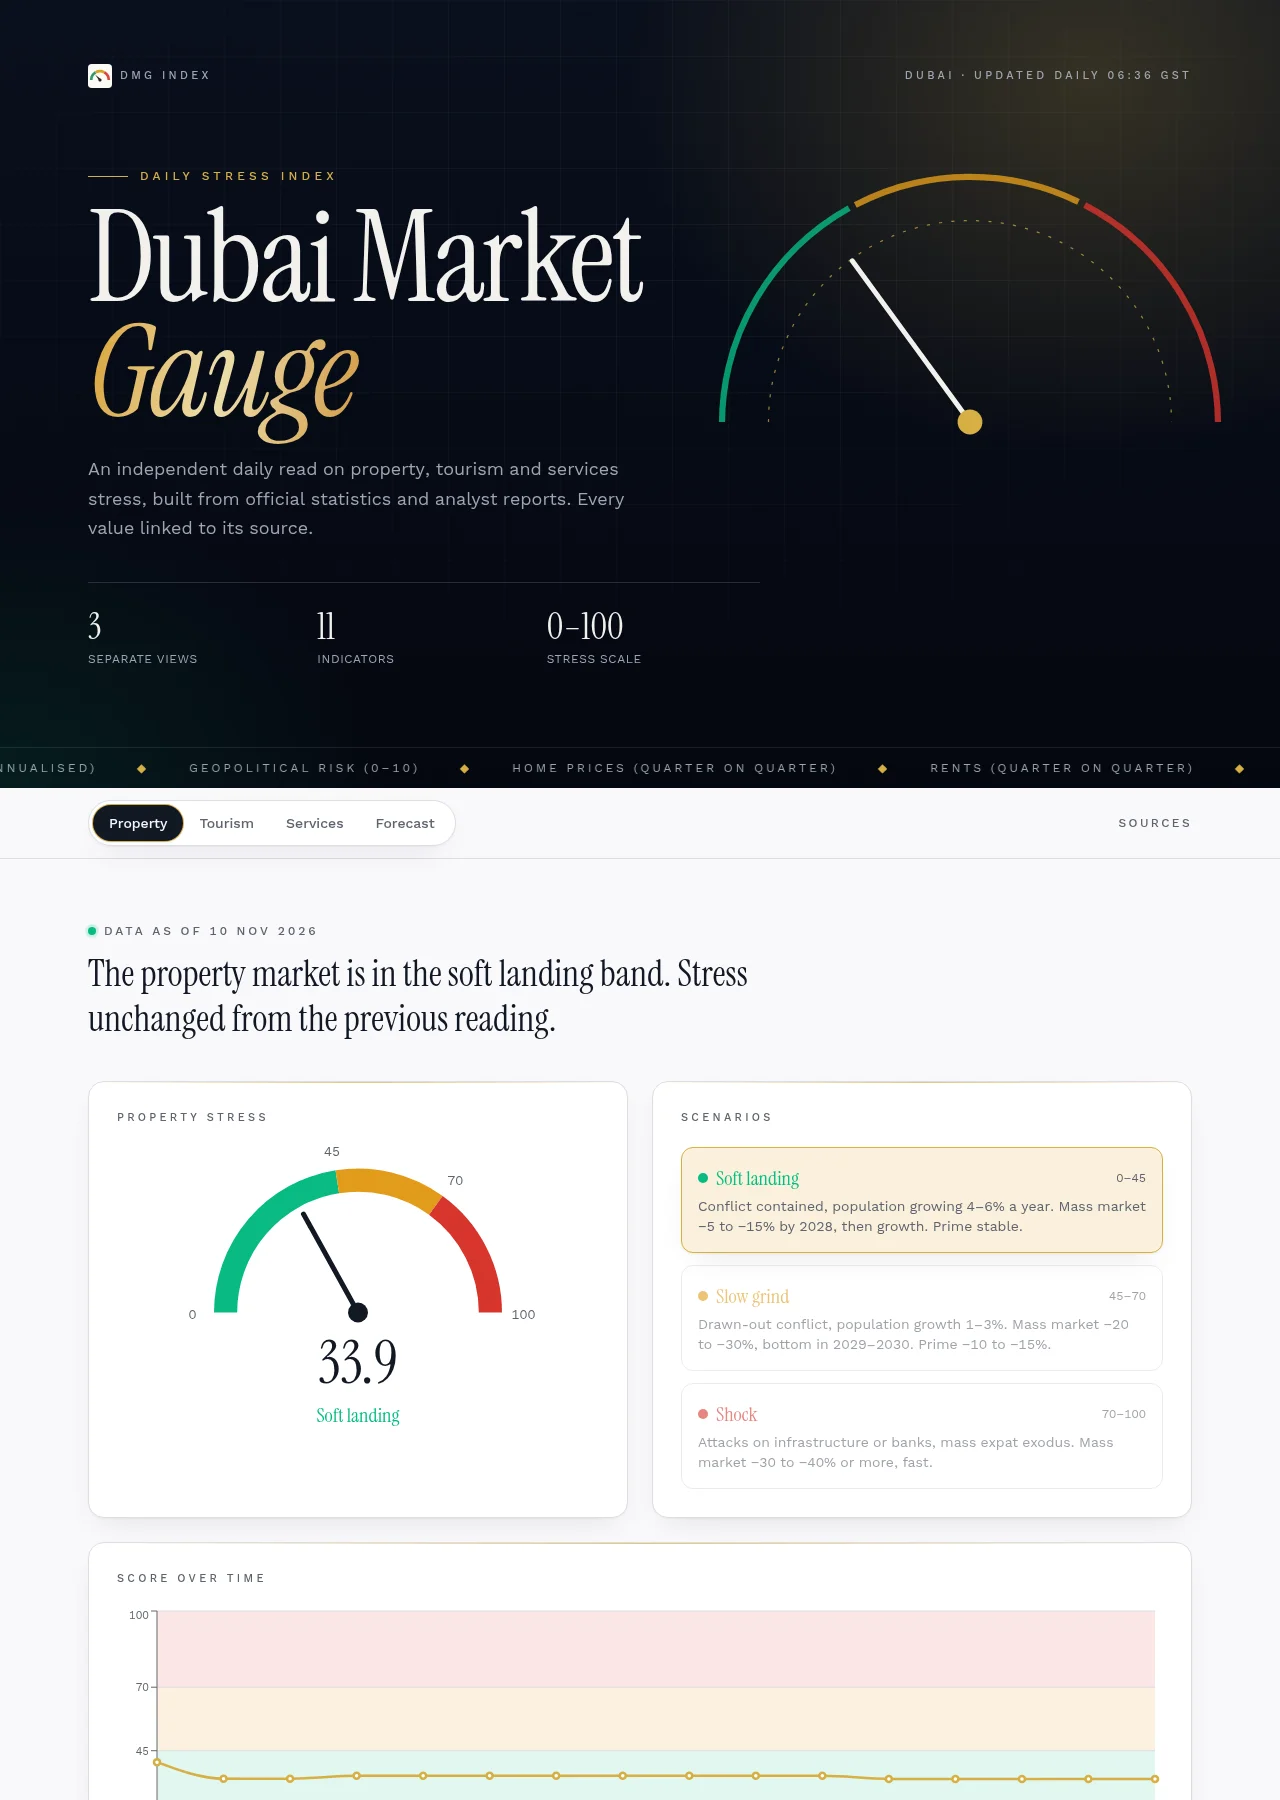
An independent public dashboard for Dubai property, tourism and services, combining stress gauges, historical charts and linked sources.
The challenge
Present different market indicators in a readable format while keeping the underlying sources and assumptions visible.
My role
I built the dashboard presentation, sector navigation, gauge visualisations and historical views.
The solution
Separate property, tourism and services views combine a stress gauge with historical scores, indicator tables, source links and scenario context.
Key features
- Property, tourism and services views
- Stress gauges and historical charts
- Indicator weights and source links
- Forecast and scenario context
- Responsive public dashboard
Selected screens
Captured from the public website on 10 Nov 2026. Private areas are not shown.
The outcome
A public dashboard that brings market readings and their source context into one scannable experience.
For information only, not investment advice. Captured scores and readings are a dated view of the public dashboard, not performance claims.
What would you like to build?
Tell me a little about it. A short brief takes about two minutes, and you review everything before it goes anywhere.